

TL;DR: Learning how to read crypto charts isn't about predicting the future—it's about understanding crowd psychology and probability. Master a few core signals and you'll trade with clarity instead of fear.
How to Read Crypto Charts: The Truth Nobody Talks About
Here's a surprising fact: most traders who study how to read crypto charts still lose money. Why? Because they treat charts like crystal balls instead of probability maps. Knowing how to read crypto charts won't make you psychic—but it will stop you from gambling blindly. So let's strip away the hype and talk about what these candlesticks actually tell you.
Why Knowing How to Read Crypto Charts Actually Matters
Think about it this way: a crypto chart is a story written by thousands of buyers and sellers fighting in real time. Every candle is a snapshot of human emotion—greed, panic, hope, regret.
What most miss is that charts don't predict anything. They reflect behavior. And behavior tends to repeat.
In my view, understanding how to read crypto charts matters because it replaces emotion with structure. When the market dumps 20% overnight, the untrained trader panics. The chart reader checks support levels and stays calm.

Here's a fact that stuns newcomers: roughly 90% of retail crypto traders lose money over time, often because they ignore basic technical analysis. But charts level the playing field a little.
Imagine driving at night without headlights. That's trading without reading charts. You might survive a few turns, but eventually you'll crash. Reading price action gives you those headlights. It won't tell you what's around every corner, but it shows enough road to make smarter decisions and avoid obvious disasters.
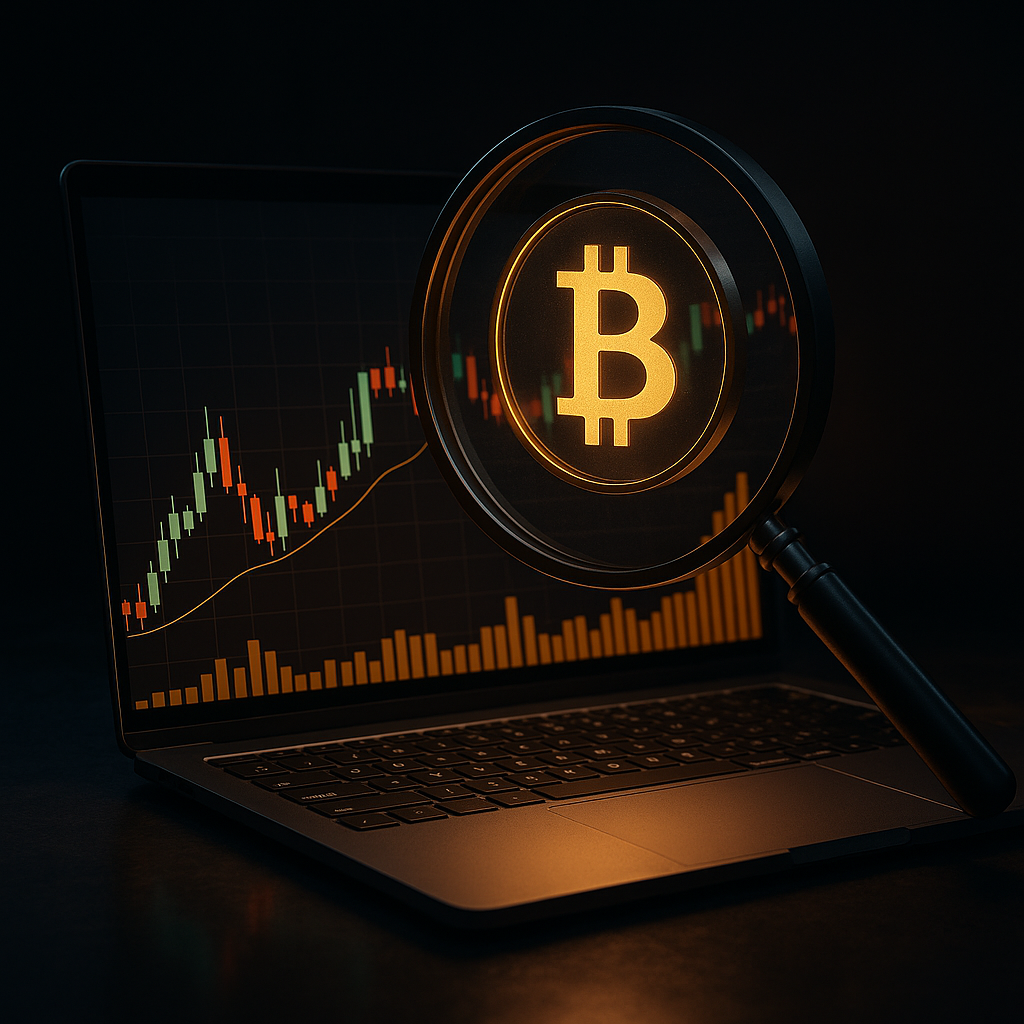
[IMAGE: Beginner studying a candlestick crypto chart on a laptop | Alt: how to read crypto charts for beginners]
How to Read Crypto Charts: A Practical Deep Dive
So how does it actually work? Start with candlesticks. Each candle shows four things: open, close, high, and low. Green means price closed higher; red means it closed lower. Simple enough, right?
But the real magic is in patterns and context.
Support and resistance are your foundation. Support is a price floor where buyers keep stepping in. Resistance is the ceiling where sellers dominate. When price breaks these zones, momentum often follows.
Volume matters too. A breakout on low volume is suspicious—like a rumor with no source. A breakout on high volume? That's conviction.
Here's the thing about indicators like RSI and moving averages: they're tools, not commandments. The RSI shows whether an asset is overbought or oversold. Surprising fact—Bitcoin has stayed "overbought" on the RSI for weeks during bull runs, trapping traders who shorted too early.
Think of chart reading like learning a language. Candles are letters. Patterns are words. Trends are full sentences. You don't memorize everything at once. You practice until it clicks.
And when you combine timeframes—daily for trend, hourly for entry—you start seeing the full conversation the market is having. [LINK: beginner's guide to candlestick patterns]
What's Happening Now in Crypto Chart Analysis
Crypto charting has changed dramatically. Why does that matter to you? Because the tools available today are wildly more powerful than even five years ago.
AI-driven indicators now scan thousands of pairs in seconds. Social sentiment overlays let traders see when retail hype is spiking. What I find interesting is how on-chain data—wallet movements, exchange inflows—now sits right alongside traditional candles.
Here's a surprising fact: some platforms report that over 70% of crypto trading volume is now driven by bots and algorithms. That means the "crowd" you're reading on a chart often isn't human at all.
So does technical analysis still work? Yes—but with a twist. Bots create cleaner, more predictable patterns because they follow programmed rules. That actually helps disciplined chart readers.
Think of it like a chess game where half the players follow textbook openings. If you know the playbook, you anticipate moves.
But there's noise too. Fake breakouts, stop-loss hunts, and liquidity grabs are more common. Modern chart reading means accounting for manipulation, not just patterns. Combine technical analysis with on-chain metrics and you get a sharper edge. [LINK: best crypto charting tools]
[IMAGE: Advanced trading dashboard with multiple indicators and on-chain data | Alt: modern crypto chart analysis tools]
What This Means for You
So where does this leave you? Honestly, in a better spot than most.
You don't need fifty indicators. You need a few you understand deeply. Start with support, resistance, trend lines, and volume. Master those before touching anything fancy.
Here's a practical opinion: backtest before risking real money. Scroll back on a chart, cover the right side, and predict what happens next. It's free practice that builds intuition fast.
And remember—no chart guarantees outcomes. They shift the odds in your favor, nothing more.
Treat trading like a skill, not a lottery ticket. The traders who survive aren't the smartest. They're the most disciplined. Risk small, journal your trades, and review your mistakes weekly. That habit alone separates winners from gamblers in this brutal market.
Frequently Asked Questions
Q: Is it hard to learn how to read crypto charts?
A: Not really. The basics—candlesticks, support, resistance, and volume—can be learned in a few weeks. Mastery takes longer and comes from consistent practice. Start small, focus on one or two indicators, and build your skills gradually rather than rushing into complex strategies.
Q: Which timeframe is best for reading crypto charts?
A: It depends on your style. Day traders use 5-minute to 1-hour charts, while swing traders prefer daily and weekly views. A smart approach combines multiple timeframes—use higher ones for trend direction and lower ones for precise entry and exit points.
Q: Can technical analysis really predict crypto prices?
A: No tool predicts prices with certainty. Technical analysis identifies probabilities and likely scenarios based on past behavior. It improves your decision-making and risk management, but markets remain unpredictable. Treat charts as guides for stacking odds in your favor, never as guaranteed forecasts.
Final Thoughts
Learning how to read crypto charts is one of the most valuable skills you can develop in this space. It won't turn you into a millionaire overnight, and anyone promising that is selling something. But it will give you clarity, discipline, and a real edge over the panicking crowd.
Here's my honest take: the truth nobody talks about is that charts reveal psychology, not destiny. Once you accept that, everything changes.
So start slow. Practice daily. Keep a journal.
Ready to sharpen your edge? Open a free chart, pick one pattern, and study it today—your future self will thank you.
